Last week Liander, one of the biggest energy network maintainers in the Netherlands installed a new smart meter at my place. Actually they installed two new meters: the Landis+Gyr E06140 to measure gas usage and the Iskra ME382 to measure electricity. Both devices are linked together and the electricity meter provides a P1 port, this is a open and accessible port to retrieve data from the meter. More information about this P1 port can be found here.
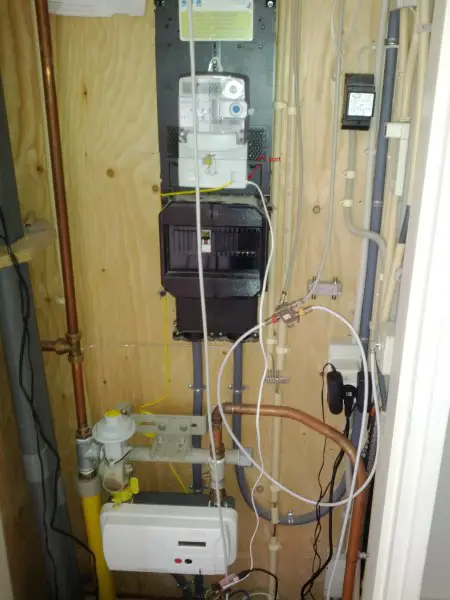
Of course I couldn’t resist that P1 port, and I just had to try and get the data out! Here’s a picture of the smart meter with the P1 port annotated (click for a bigger picture):
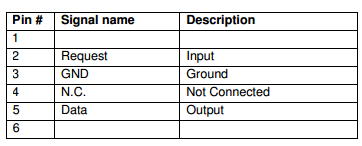
The P1 port is a RJ11 port, using the following pin out:
I grabbed an old modem cable, with RJ11 plug and then I connected the appropriate pins to a modern devices USB-BUB. This device provides all the pins required. The request pin, as described above must be kept “HIGH” to retrieve data (i.e. provide 5V all the time). So I connected the request pin to the USb-BUB 5V. The other pins are DATA for the output, which I connected to the RX pin of the USB-BUB and GND which I obviously connected to the USB-BUB’s ground. This is a temporary solution until I get a proper 5V FTDI cable.
Note: to connect to the serial port, you need special port settings: 7 data bits (instead of the more regular 8) with even parity at 9600 baud.
Software
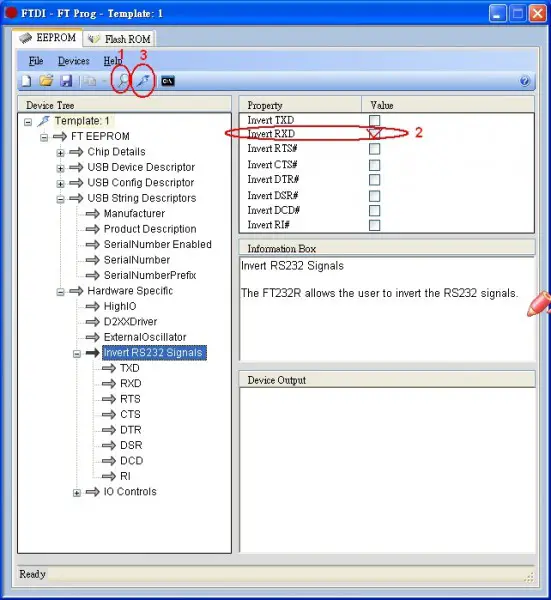
The P1 port uses a reversed serial protocol (1=0 and 0=1), to get this to work with a FTDI chip (this chip is used on the USB-BUB) you need to reverse the RX pin. Luckily FTDI provides a tool known as FT_PROG to do this. Thanks to Verkenner on the domoticaforum for figuring this one out. Here is a screenshot which shows you how to make the inverse RX setting in FT_PROG:
After programming you can also use the same cable under Linux, which is good because I run HouseAgent on Linux. Creating a plugin for HouseAgent was an easy task, it took me roughly 1.5 hours. For those of you interested in this plugin, you can find it’s source on Github.
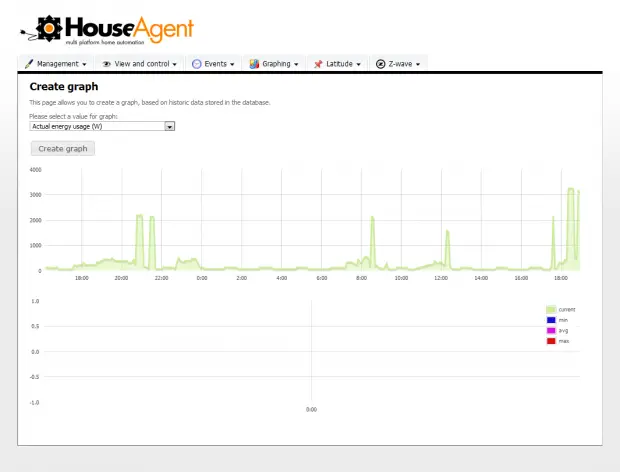
And because of the built in graphing capabilities of HouseAgent (the screenshot is v0.2 btw 🙂 ), it was easy to create a graph of the current power usage (click for larger image):
One more thing I would like is bar charts of power usage over a longer period, but this requires some modifications in HouseAgent.
So there you have it, total insight on energy and gas usage!


Interesting. The information about the P1 port is gone from the original website, but still floating around in google.
If you only connect GND, RX and 5V, at what rate is this meter sending information? Is it a continuous stream?
The information is accessible for me, at least right now.
Once you keep request pin high (5V) data comes in every 10 seconds.
Well, I get a 404 requested information not found – also right now. YMMV.
http://read.pudn.com/downloads145/doc/633047/DSMR%20v2.2%20final/Dutch%20Smart%20Meter%20Requirements%20v2.2%20final%20P3.pdf
is versie 2.2 van hetzelfde document.
Is Gas and Electra readable from the same P1 port on the Electra meter?
Yes, the gas meter is “linked” to the electricity (smartmeter) and readout is via the same P1 port.
Mijn meter is niet helemaal in orde, lijkt het. De cumulatieve totalen kloppen altijd, maar hij wisselt nogal in het aangeven van het huidige verbuik in het hoge of lage tarief. Het komt meerdere malen per dag voor dat het huidige verbruik zomaar van het hoge naar het lage tarief (of andersom) wisselt.
Dit is er eentje van net:
/ISk5\2MT382-1003
0-0:96.1.1(5A424556303035303639353031323131)
1-0:1.8.1(00130.170*kWh)
1-0:1.8.2(00075.646*kWh)
1-0:2.8.1(00041.171*kWh)
1-0:2.8.2(00077.816*kWh)
0-0:96.14.0(0002)
1-0:1.7.0(0000.00*kW)
1-0:2.7.0(0001.30*kW)
0-0:17.0.0(0999.00*kW)
0-0:96.3.10(1)
0-0:96.13.1()
0-0:96.13.0()
0-1:24.1.0(3)
0-1:96.1.0(3238303039303031313433333135313131)
0-1:24.3.0(120514090000)(00)(60)(1)(0-1:24.2.1)(m3)
(00059.854)
0-1:24.4.0(1)
!
dus nu, op maandagmorgen 09:48, 1300 W gebruik in het lage tarief. Het actuele verbruik lijkt nogal willekeurig te wisselen tussen 1-0:1.7.0 en 1-0:2.7.0. Bellen met Liander hierover was geen leuke ervaring (ook niet voor de helpdeskmevrouw die niets wist en ook niet wilde doorverbinden).
Iemand enig idee? Zowiezo zou het veel fijner zijn om het verbruik of desnoods ampere per fase uit te kunnen lezen. Misschien moet ik 0-0:96.14.0 (current active tariff) gebruiken? Maar waarom zijn er dan twee velden met het actuele verbruik?
@Jurriaan,
Ik denk dat je je vergist. Deze 2 metingen zijn niet het actuele gebruik per tarief, maar de ene meter is wat je afneemt, de andere wat je terug leverd.
Ik neem aan dat je iets van zonnepanelen op hebt staan want
1-0:1.7.0(0000.00*kW)
1-0:2.7.0(0001.30*kW)
betekend dat je dik aan het terugleveren bent
0-0:96.14.0(0002) Deze geeft aan in welk tarief je momenteel zit (2 is overdag)
Dat verklaart een hoop; we leveren inderdaad terug.
Mooi dat je dit hebt beschreven.
Ik heb sinds gisteren ook een ME382 en wil wel graag mijn rapberry pi er aan hangen, maar kan je bij die P1 zonder zegels te verbreken?
gr,
Ewald…
Hallo!
Ik heb net zo’n RJ-11 kabeltje gemaakt. Het enige probleem is dat ik om de 10sec een lading bagger krijg (op 9600 7E1). Nu kan dit zijn omdat ik de RXD nog niet geinverteerd heb, weet iemand hoe dit kan op Linux?
Chris
Het probleem is al opgelost. Ik heb mijn FTDI kabeltje opnieuw geprogrammeerd (ik wist ook niet dat er een stukje eeprom op zat) om de RXD te inverteren. Probleem opgelost!
@Ewald: voorwaarde van de P1 poort is dat deze vrij toegankelijk is, dit is opgenomen in de standaard!
So these values confuse me:
1-0:1.7.0(0000.05*kW)
1-0:2.7.0(0000.23*kW)
Up here you’re saying that one of them indicates what you’re using from the network, the other means what you’re delivering. I’d expect that one of those must be zero, no? I really would like some data on how much power is being generated + used but the meter seems to not know/care enough to share. 🙁
Maarten,
Ik ben met een projectje bezig om mijn ISKRA uit te lezen met mijn servertje. Ik ben niet helemaal niew in electronica/IT, maar dit heb ik niet eerder gedaan. Ik kwam deze post tegen, heel behulpzaam. Daarvoor dank! USB-BUB is onderweg (is voor mijn handiger dan een kabeltje, de server staat niet in de buurt van de meter).
Vandaar mijn vraag: kun je de TX van de USB-BUB aansluiten op pin 1 (request)? Dan kun je zelf bepalen wanneer je informatie wil ontvangen (kwestie van wat data naar /dev/ttyusb0 schrijven, lijkt me). Ik heb genoeg aan 1 keer per minuut data ontvangen.
Mic
@Mic;
Zat zojuist hetzelfde te denken en ben benieuwd of jij ondertussen al iets gevonden hebt.
Hai Maarten,
Ben al een poosje op zoek naar een tool om meterstanden weertegeven via web page. HouseAgent ziet er goed uit.
Inmiddels heb ik een perl script draaien die een Mysql Db vult om de 5 minuten met data.
Ik heb 2 meters, een Iskra Mt171 (PV brutoproductiemeter helaas zonder decimals) en een Iskra MT382 (gisteren geplaatst) met diverse output.
Ik lees de meters uit via 2 IR heads gekocht in duitsland bij Udo.
uit te lezen via ttyUSB0 en ttyUSB1.
System waar het opdraait is Raspberry Pi.
kan dit geimplementeerd worden binnen HouseAgent?
graag advies welke stappen ik oet ondernemen.
mvg
Henry
Dit kan zeker met HouseAgent. Ik zal binnenkort een blog schrijven over een basic inrichting voor een smartmeter. Ik krijg er veel vragen over.
Hoi Maarten,
Ik heb alles draaiende op een Raspberry PI (DEBIAN install) met een FTDI rs323 USB dongel en een wifi USB dongel. Dit aangesloten op een ISKRA MT382. Ik zou graag jou oplossing willen gebruiken met de HouseAgent. Maar ik loop tegen een uitdaging aan die ik niet kan rechtzetten omdat ik het niet zie. Graag enig hulp.
Ik kan de webpage benaderen en alle instellingen doen.
Maar bij het laden van de PLUGIN Smartmeter.py geeft hij de volgende WARNING in m’n SSH Terminal scherm:
root@raspberrypi:/var/www/HouseAgent# python HouseAgent.py
2013-02-01 11:34:39,390 [Main] DEBUG: Starting HouseAgent database layer…
2013-02-01 11:34:39,406 [Main] DEBUG: Starting HouseAgent coordinator…
2013-02-01 11:34:39,420 [Main] DEBUG: Starting HouseAgent event handler…
2013-02-01 11:34:39,429 [Main] DEBUG: Starting Houseagent history aggregator
2013-02-01 11:34:39,472 [Test] DEBUG: Attempting to create archive db: archive_2013_02.db
2013-02-01 11:34:39,503 [Main] DEBUG: Starting Houseagent history collector
2013-02-01 11:34:39,530 [Main] DEBUG: Starting HouseAgent web server…
2013-02-01 11:34:39,548 [Main] DEBUG: –> Plugin directory found, directory: smartmeter
2013-02-01 11:34:39,553 [Main] WARNING: –> Warning cannot load pages module for smartmeter, no pages.py file?
2013-02-01 11:34:39,591 [Test] DEBUG: Creating new archive db.
2013-02-01 11:34:39,606 [Main] DEBUG: Database schema is up to date
2013-02-01 11:34:39,620 [Main] DEBUG: Loading plugin Smart Meter
2013-02-01 11:34:39,659 [Aggregator] DEBUG: Scheduled tasks: {}
2013-02-01 11:34:39,770 [Collector] INFO: Collection for value: Test is disabled.
2013-02-01 11:34:39,777 [Collector] DEBUG: Sheduled tasks: {}
Dit is een normale foutmelding, de smartmeter plugin heeft geen web interface..
Hoi, weet iemand hoe je de P1 kunt uitlezen met een Moxa nPort 5110 ?
Ik heb e.a. geprobeerd maar het lukt niet helemaal.
Doel is om de P1 date elke 10 sec. naar een server (GIRA HomeServer) te sturen zodat de data in de domotica installatie kan worden gevisualiseerd.
Wat gaat er precies mis? Ik heb zelf geen ervaring met een Moxa (niet in dit verband, wel zakelijk)
er is geen communicatie van meter naar nPort. Tenminste, de rx/tx LED doet niets, en de monitor laat ook niets zien.
Ik vermoed dat het RTS signaal niet goed is. Ik heb geen vaste +5v op de 9-polige connector van de nPort, en probeer dit met een andere sigaal te krijgen maar heb weinig ervaring met RS232. Weet uberhaubt niet of het wel klopt met TTL niveau’s van P1 poort
Dit gaat je niet lukken zo. De Moxa gebruikt echte RS232, geen TTL.
Je zult iets van een MAX232 (Google) moeten gebruiken om de TTL logic levels om te zetten naar RS232. Verder moet je nog zorgen voor de inversie. Dit zou je kunnen doen door een opto coupler tegen de signalen van de smartmeter te gebruiken.
ok thnx. Ik heb geen zin/tijd om te solderen enzo. Ik zoek een compleet stukje hardware. Mag best wat kosten. Misschien iemand hier die een proto wil maken, en evetueel meerdere als het goed werkt ?
Kan het wel met een andere P1ethernet ‘ding’ ?
Misschien een ander type nPort oid ?
Ligt een beetje aan wat je aan de andere kant hebt zitten. Welke (scripting) mogelijkheden heb je daar? Je zou eens kunnen kijken naar Robert zijn oplossing: http://blog.hekkers.net/2012/10/27/a-smarter-smart-meter/ (ethernet gebaseerd)
Ik kan wel prototypes en prints ontwerpen.. voorwaarden daarvoor moeten we anders even via de mail bespreken..
Nou, wat een toeval. Twee weken na het zelf laten vervangen van mijn stokoude groepenkast krijg ik van Liander een nieuwe Iskra ME382 meter!
Ik zie dat hij een (verplichte) data-poort heeft, en ik zie hier en der de pogingen van dappere pioniers om die data-poort te gebruiken. Petje af!
Hoewel ik in het verleden vaak genoeg eigen RS232 soldeer en print projectjes heb ondernomen, ben ik nu niet echt “in the mood” om mijn pioniers-costuum uit de kast te halen.
Dus, mijn vraag, mijn boodschap aan de community: schiet eens op met een twee/drie-tientjes turnkey oplossing om die data uit deze meter online te krijgen.
Mijns inziens zou dat op basis van een Raspberry PI moeten kunnen of desnoods een Android MK802, maar dat lijkt mij overkill.
Met online bedoel ik wifi of kabel via de thuis router, direct naar bijvoorbeeld een gratis Google spreadsheet, via hun API: https://developers.google.com/google-apps/spreadsheets/#adding_a_list_row
Die biedt alle charts en foefjes die je maar zou wensen.
Als ik hierin iets kan betekenen voor iemand laat maar hier weten.
Als tegenprestatie kan ik mijn laatste projectjes bieden: enkele simpele stappen om voor drie tientjes zonder een Experia en met je eigen router van alle diensten van een NL glasvezel abonnement te genieten (Alleen KPN etc.).
Groeten en succes, Nick
P.s. mijn collega waarschuwde mij dat criminele inbrekers-bendes deze meters prachtig vinden om vanaf straat te bepalen dat iemand wegens langdurig laag verbruik dus op vakantie zal zijn…
@Nick
Dat is ook mijn grootste probleem met het remote uit kunnen lezen van de meters.
Ze kunnen mij 100 keer vertellen dat het niet mogelijk is, maar als je aan de bakkersvraagt of zijn eigen brood goed smaakt weet he het antwoord ook….
Ik krijg binnenkort ook mijn smartmeter, en het remote uitlezen is het eerste wat dicht gaat..
(R-Pi staat al klaar en kabeltje moet ook ergens komende dagen binnen moeten zijn.)
Inmiddels hangt mijn Raspberry Pi (plus WiFi) met een kabeltje aan m’n ME382. Ik lees de meter vervolgens uit met deze command line:
cu -l /dev/ttyUSB0 -s 9600 –parity=none. Het werkt uitstekend. Onder SSH (Putty) worden de standen op het scherm gedumpt. Maar ik wil deze standen in mijn MySQL database opnemen en er daarna van alles mee doen.
Henry van Gestel schrijft op 30 januari 2013: “Inmiddels heb ik een perl script draaien die een Mysql Db vult om de 5 minuten met data”. Daar ben ik natuurlijk hevig in geinteresseerd! Heb al enkele jaren ervaring met MySQL en Perl, vandaar.
Henry of iemand anders, kun jij me helpen?
Beste forumfanatiekelingen, een diepe buiging uit respect voor al het werk wat jullie verrichten en het nivo waarop jullie bezig zijn.
Mijn tijd als transistorbakker (bc547 via 2N3055 naar MRF en BLY90 🙂 ) is ver voorbij en na het frituren van een SST-90 LED van luminus (duur maar wél mooi!!) weet ik dat ik zal moeten leunen op de kennis en ervaring van de nieuwe lichting pioniers.
Na lang googelen en kijken naar systemen die óf met stroomtrafo’s over de voedingskabels óf met traag en onbetrouwbaar knipperende LEDs van mijn oude ISKRA meter werken, ga ik maar uit van een te plaatsen slimme meter waarvan ik het op afstand lezen direct uit laat zetten. Niet dat dat een verzoek van justitie zou tegenhouden als men persé wil kijken wat ik doe maar dan heb ik denk ik andere uitdagingen aan mijn hoofd en zal het voor mij niet belangrijk zijn of men kan zien dat ik een plasma aan of uit heb staan 🙂
Na een leuk gesprek met plugwise kom ik er achter dat het monitoren van het verbruik met een 3-fasen meterkast met teruglevering op een fase, een investering van minstens 300 euri vergt met een verplicht abonnement van 36 euri per jaar……. Dat moet dus beter kunnen lijkt me
Enexis had een mooie voorzet samen met een ontwikkelaar die voor een paar tientjes een mooie interface van P1 naar ethernet maakte met galvanische scheiding maar dit ontweek LIJKT dus te zijn terechtgekomen bij plugwise.
Ik heb een Qnap NAS in de meterkast staan en een win7 pc (dual atom met SSD tbv de SMA omvormer die maar 11Watt gbruikt idle) en kan dus op twee platforms de data opslaan.
Wie o wie kan deze hobbyist helpen aan soft en/of hardware om ZONDER dat ome Liander of Plugwise naar mijn data kijkt mijn verbruik te monitoren en te loggen?
Ook dit verzoek aan Maarten met mijn complimenten voor de tijd en energie die je gesoken hebt in het aan de wereld kenbaar maken van je zeer interessante projecten, respect!!
Als een hacker/inbreker de meter vanuit de straat kan uitlezen is dat dan voor de gebruiker/eigenaar geen mogelijkheid om dat ding zonder kabels uit te lezen?
Ben benieuwd naar de reacties.
Meters worden do. geplaatst. RPi ligt in de startblokken.
Afgelopen week ook zonnepanelen kWh meter via S0 aangesloten op de FTDI kabel.CTS op S0+ en GND op S0-.
Paar regels python en een php scriptje resultaten staan op PVOutput…
Ruim een jaar na dato, maar toch een paar (mogelijke) antwoorden:
Wilmer says, August 26, 2012 at 01:02:
1-0:1.7.0(0000.05*kW), 1-0:2.7.0(0000.23*kW): Leveren en verbruiken tegelijk lijkt mij niet mogelijk bij een enkel-fase systeem. Maar bij een meer-fase systeem (3-fase) is dat goed mogelijk: De levering over de ene fase en het verbruik over de andere fase.
Voor de knutselaars: op http://gejanssen.com/howto/Slimme-meter-uitlezen/index.html heb ik mijn bron voor een raspberry-pi meteropnemer.
Voor de paranoya onder ons: van de monteur begreep ik dat voor het meter-opnemen op afstand, de meter is voorzien van een gsm-module, waarbij ook de antene in het meter-blok zit. Het geheel in een kooi-van-faraday zetten en die is niet meer uit te lezen. Een kapje van aluminiumfolie kan wonderen doen, verpak je mobieltje maar eens in alu-folie en bel ze op…
Hi,
I found this posting when looking for electrical meters with a blinking LED to indicate used energy.
Most energy meters in Sweden have the type of electrical meter that have a blinking LED.
As it seems Iskra and Landis+Gyr also have that. This thread is about using the P1-interface which I have not seen before. Are there more things that can be extracted except for used energy (Wh)?
Instead of using the P1-port, have you considered using the blinking LED instead?
I have a wireless solution that can be used with a Tellstick DUO/NET or RFXtrx433 device.
No cables will be needed. Have a look and see if you like it.
You can read about it here, http://foogadgets.blogspot.se/2014/01/wireless-energy-meter.html
/Niclas, Sweden
Ik heb het ook bijna aan de praat lijk het. Maar de output of liever de input is nog niet helemaal lekker. Volgens mij mis ik een stukje
Hardware:
* Raspberry Pi Debian Weezy bereikt via Putty op SSH
* UTP cable 1 kant RJ11 andere Kant RJ45
* DB9 Female naar RJ-45 Female Modular Adapter (RTS –> 7, GND –> 5, RxD –> 2)
* Serial naar USB (usb naar db 9p seriële poort kabel)
Dit krijg ik nu binnen bij draaien ‘cu -l /dev/ttyUSB0 -s 9600 –parity=none’:
——–
/I*=%MT382-1003
0-0:96.1/1(5A424SS*J363l&6-L(kR
sB.1(05560.67M5=/=L(kR
sBsC+2Bs#C*kWh)
1-0:2.8/1(00000/001*kWhjc!kRsB.2(00000.001*k)
0-0:96/14.0(0001)
1-0;1.7.0(0000.96*k]k
1-0:2.7/0(0000.00*kW)
0-0:17.0/0(0999.00*kW)
0-0;96.3.10(1)
0-0;96.13.1()
0-0:N)BJk
0-1:24.1/0(3)c!j
:96.1.0(323830&313030&323135&6&[C
0Kl’6rB
#
207200000jJ(60j
KCj
S#s.1)(m3jc! “r)
0-1;24.4.0(ljc(j
——–
Er komt dus wel wat uit maar het is nog een rommeltje.
Iemand enig idee hoe dit te kunnen verbeteren?
BVD