In this blog post I will explain how to use an System Center Operations Manager OleDB watcher to monitor an Oracle database.
This can be useful to monitor a mission critical application on database availability. It’s also a cheap solution to just monitor the connection state of an Oracle database, rather then installing an (expensive) third party Oracle management pack. Off course these packs have a lot more monitors then the connection state, but that might not always be an requirement.
To get this done, the following steps must be taken:
- Install Oracle client OleDB provider on the watcher node
- Test the Oracle client OleDB provider, and connection to the database
- Add OleDB monitoring in SCOM
- Add associated runas user profiles
Installing the Oracle client OleDB provider on the watcher node
The watcher node can be any machine containing the SCOM agent.
It’s important to have the right Oracle client version (I used version 11), for 32bit versions use the 32bit Oracle client. For 64bit use the 64bit Oracle client version. Both are available on the Oracle website. If you don’t use the correct version (e.g. 32bit on 64bit) you might get “Class unknown” errors within SCOM.
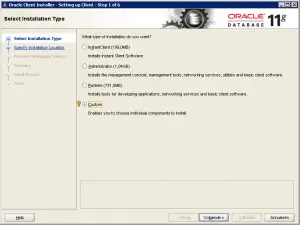
Start the Oracle installation, on the first step in the installation wizard choose “Custom” and click “Next”
On the next page select your favorite language(s), then pick a location for the Oracle client (beware it’s huge, even for one component)
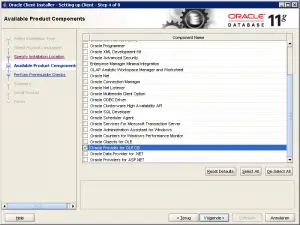
In the “Available Product Components” step select the following component (Oracle Provider for OLEDB:
Finish the installation.
Note:you also need to setup Oracle’s tnsnames file, this is beyond the scope of this article. Consult your Oracle DBA.
Test the Oracle client OleDB provider, and connection to the database
To test a OleDB connection, you can use a UDL file. This is a connection file, which launches a wizard once you click it.
Use the following steps to create an UDL file:
1. Make sure in Windows Explorer, Tools->Folder Options, View Tab, that “Hide file extensions for known file types” is not checked.
2. Right click on Windows desktop, and select New->Text File.
3. Name the file “Test.udl”. The icon for the file should now be the special “UDL” icon.
4. Double click the file to open the Data Links dialog.
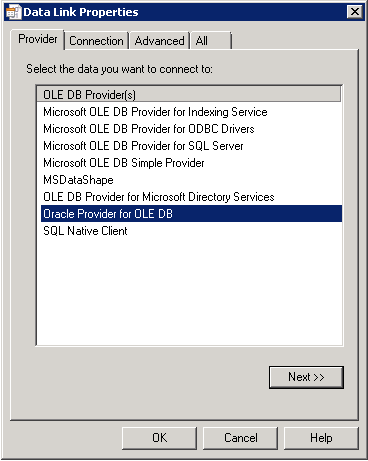
5. Click on the “Provider” tab. Select “Oracle Provider for OLE DB”.
6. Click on the “Connection” tab. In the first dialog box (server name) type the oracle service ID (the name defined in the tnsnames file)
7. Specify the credentials (username and password) in the same dialog box.
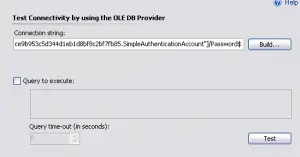
8. Click “Test Connection”, you should now see this embracing message 🙂
Add OleDB monitoring in SCOM
The next step is to add monitoring to SCOM. Start the SCOM operations manager console and click on “Authoring”.
Within this view, click on “Add Monitoring Wizard” on the left hand side.
To add an OleDB watcher, use the following steps:
1. In the “Select Monitoring Type” step select “OLE DB Data Source”, click “Next”
2. Within the general properties step specify a name for the monitor and choose a Management Pack for your custom monitoring (Microsoft recommends not to use the default management pack here, so create a new one!)
3. In the Connection String dialog click on the “Build…” button. Choose any random Provider (we will change the connection string later on) enter a random computer name and database as well. Make sure you check: “Use Simple Authentication RunAs Profile created for this OLE DB data source transaction”, this is important.
4. Enter Query performance thresholds, if this is required.
5. Within the “Watcher Nodes” step, select the machine on which we installed the Oracle client.
6. Finish the wizard.
You should now end up with an OleDB Data Source within SCOM.
Open the data source and navigate to the “Connection String” tab.
Change the connection string in to the following format:
Provider=OraOLEDB.Oracle;Data Source=TEST;User Id=$RunAs[Name="OleDbCheck_b7035c5b5d6149b684df79089e99dc07.SimpleAuthenticationAccount"]/UserName$;Password=$RunAs[Name="OleDbCheck_b7035c5b5d6149b684df79089e99dc07.SimpleAuthenticationAccount"]/Password$
Replace the RunAs variables with the ones generated by the wizard. The data source is the Oracle SID, the same you used to test before. The provider name is the short (internal) name for the Oracle Provider for OLEDB.
Save the OLEDB Data Source.
Add associated runas user profiles
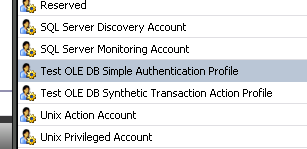
If you checked the “Use Simple Authentication RunAs Profile created for this OLE DB data source transaction” during the wizard you should end up with a preset RunAs profile for this monitor. You can find it under Administration->Run As Configuration->Profiles in the operations manager console.
Double click this “simple authentication” RunAs profile.
To add a “Run As Account” follow the following steps:
1. In the “Run As Profile Wizard” click the “Run As Accounts” tab.
2. Click on the “Add…” button to add an account.
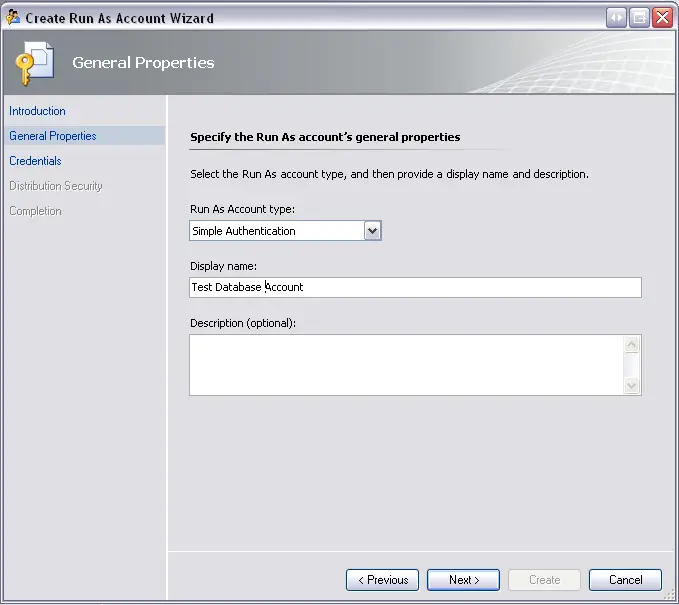
3. Click on “New…”, the “Create Run As Account Wizard” should now start. Skip the introduction.
4. On the general properties page, select the run as account type. Set this to Simple Authentication and specify a display name.
5. On the credentials tab specify the account name and password.
6. Select a distribution security option, based on your preference. I used the More Secure option (you need to reopen the account under the accounts pane to distribute it to your watcher node)
7. Finish the “Create Run As Account Wizard”
8. Click “OK” and finish the “Run As Profile Wizard”
You have now configured the Run As profile.
To see the result of all this work, open the “OLE DB Data Source State” view within the monitoring pane. This is located underneath the “Synthetic Transaction” folder.
This could take a while! (It took about 15 minutes in my environment)
11 thoughts on “Monitor an Oracle database with a SCOM OleDB watcher”
Comments are closed.
Recent Posts
The time is finally come! Samsung have released their Galaxy Watch 4 series of watches. It features Google Wear OS 3. and it comes in two models, being the standard model and the watch 4 classic. In...
Microsoft 365 Defender cross check with on-premises Active Directory
Recently I was reviewing the new Microsoft 365 Defender portal and I noticed that a few endpoints were missing from the device inventory. This got me thinking that it would be great if I could...


Great blogpost! Thank you!
When I switch from User ID=XXXX to User ID=$RunAs[Name=”OleDbCheck_136d4191561643c88637a181e123f31e.SimpleAuthenticationAccount”]/UserName$ I get the following message:
Failed to process the request. Reason: An illegal token, $RunAs, is contained in the task overrides.
I’m running OpsMgr 2007 R2.
If you are using the Simple Authentication Run As profile, when you click Test, you will receive an error message (“Illegal token, $RunAs, is contained in task overrides”) . If you have configured the Run As profile correctly (as described in How to Create and Configure a Run As Profile in Operations Manager 2007), you will have full OLE DB monitoring functionality, despite not being able to test the query.
If you see an HRESULT error message when you click Test, or if you see an HRESULT error message in the Operations console after you create the OLE DB monitor, you may have made a mistake when you typed the connection string or the query. Check these and try again.
Thanks for the valuable addition.
Very nice! What if I would like to do more than just a connection test? You can pass along a query for the test, but you can’t actually work with the result of your query, for example raising an alert. Or can you?
I haven’t found a simple way to do this, except for writing an MP.
Hi,
first of all, sorry for my bad english 😉
Thanks for your post. I´m sorry, but I have some problems to configure my Operation Manager with your description.
Perhaps you can help me 🙂
I want monitor my Oracle DB on a linux system.
I installed the Oracle Client Provider on my WindowsClientPC, where the SCOM Console was installed.
But there is no TNSNAMES.ora file. Why?
What ist meant with watcher-node?
I hope you can help me.
Many greetings,
Chris
Thank you Maarten, awesome article!
I was able to follow your instructions and Install Oracle client OleDB provider on the watcher node,
Test the Oracle client OleDB provider and connection to the database with success.
However, after i Added OleDB monitoring in SCOM and runas account to its profile; SCOM is showing me “The OLE DB Database Transaction experienced an error while connecting and/or executing the query. Status code : 1.” alert and watcher node is being flooded with Event ID 11852. “OleDb Module encountered a failure 0x8007007e during execution and will post it as output data item. The specified module could not be found.”
Do you happen to know why that could be? I did some digging but was unable to find a solution. I figured perhaps you can steer me into the right direction.
https://uploads.disquscdn.com/images/1829995fb84a921633064b97c6fd5bde5b95d535fd8f1cd935359d45b3370796.png